Support and Resistance:
| Line Studies | Fibonacci | Pivot | Moving Average | Bollinger |
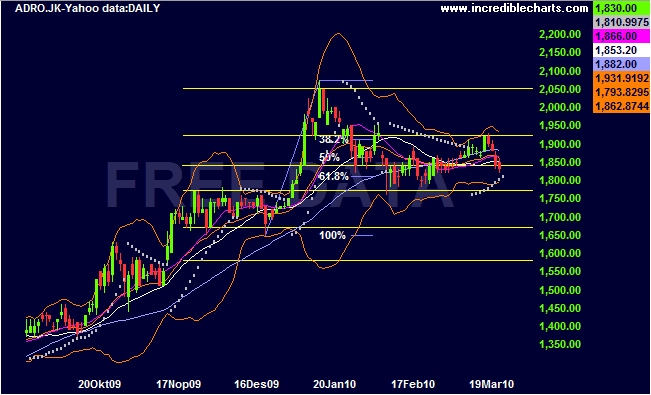
| 2050 | 0% @ 2075 | 1990 | SMA 15 @ 1866 | Upper @ 1931 |
| 1920 | 38.2% @ 1912 | 1960 | SMA 25 @ 1853 | Middle @ 1862 |
| 1840 | 50% @ 1862 | 1920 | SMA 50 @ 1882 | Lower @ 1793 |
| 1770 | 61.8% @ 1812 | 1890 (Pivot) | - | - |
| 1670 | 100% @ 1650 | 1850 | - | - |
| 1580 | - | 1820 | - | - |
| - | - | 1780 | - | - |
Recommended Actions:
- Buy @ 1840 (support line, pivot support, and SMA 25).
- Average Buy @ 1770 (support line, and pivot support).
- 1st Sell Target @ 1920 (resistance line, pivot resistance, and upper Bollinger band).
- 2nd Sell Target @ 2050 (resistance line).
- Stop loss (or simply wait) if the price goes below 1670.


0 comments:
Post a Comment